In an ongoing effort to quantify the uncertainties in GLIMS results due to analyses taking place at different institutions and by different people, a second experiment is being undertaken in which each Regional Center (RC) will analyze the same images to produce glacier outlines and various scalar attribute data. The first comparative image analysis experiment (dubbed the Round Robin) revealed several potential pitfalls in processing, data reporting, and image interpretation. In GLACE II we aim to help participants avoid these pitfalls while focusing on one of the main goals of GLIMS: Change Detection. Participants will analyze glaciers in a region seen in two images separated by 9 years. The results will be sent to the GLIMS team at the U.S. National Snow and Ice Data Center (NSIDC) for compilation and analysis. The combined results of this and the first experiment will be published, with input and co-authorship from the participating RCs. Participation is expected of all RCs who wish to be considered "active."
The ultimate goal of GLACE II is to extract a quantitative estimate of confidence in GLIMS analysis results. We have designed the experiment to maximize the information we can extract on sources of variability in analyses.
An ASTER scene from 21 Sept 2000 has been selected for analysis. Each RC will also analyze the same glacier from a Landsat5 TM scene from 21 Sept 1991 (exactly 9 years earlier). This will allow us to analyze the ability to detect change based on images from different instruments with different characteristics, such as spatial resolution. The region selected for analysis is in the Canadian Coast Mountains. We are not aware of any analysis that has been done to date on this system. Although we realize not all RCs will have glaciers with morainal material in their domains, we believe the ice field in this image will provide a region of clean ice that should work well with the algorithms tuned for more high-latitude types of glacier. Moreover, we are interested in the determination of snow lines, which are well represented in these images, and ask that this determination be included in the analysis results.
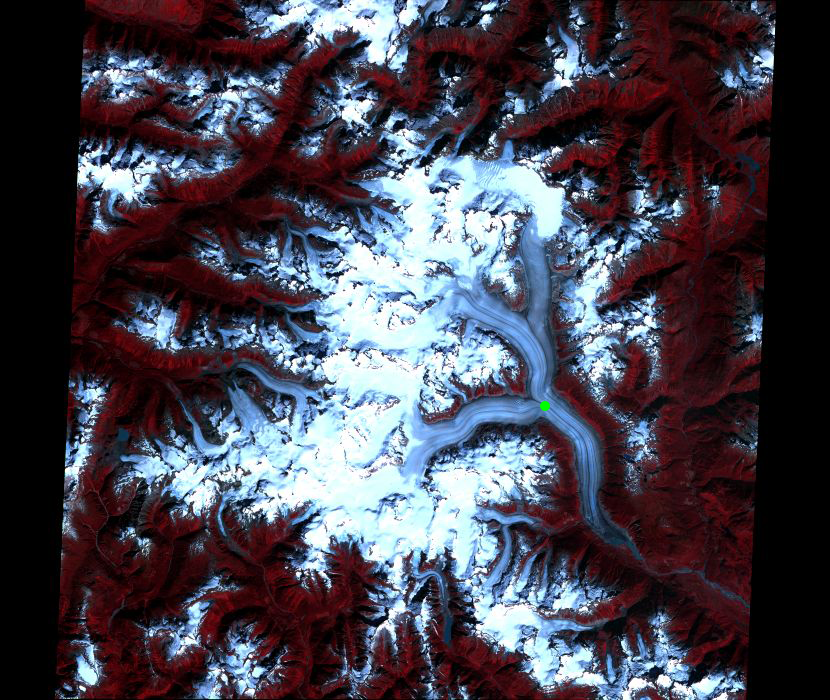
To meet the goals of GLACE II each Regional Center (RC) will analyze the large branched glacier indicated by a green dot at approximately 51.444°N, 125.850°W in the ASTER scene shown in Illustration 1. This will involve determining what portions of the ice field contribute to the various branches of this glacier. A DEM from the Shuttle Radar Topography Mission has been provided for this purpose. A DEM could also be made from the ASTER scene if desired.
Illustration 1. ASTER Scene from 21 September 2000. The green dot indicates the glacier that is to be analyzed.
This experiment is focused on quantifying the uncertainties stemming from use of different image classification algorithms, as well as variations in human interpretation. We ask that analysis be carried out using whatever tools and algorithms you think appropriate. However, because not all RCs have ready access to orthorectification software, DEM-based orthorectification should not be done, since this would cloud the comparisons between results from orthorectified and non-orthorectified images.
Because misregistration of the ASTER image was a common problem in the previous experiment, we are providing additional checks to ensure that the images are correctly geolocated before the analyses are started. In addition to pointing to the "Geo-Referencing ASTER Level-1B Data" document (below), we are supplying the coordinates of a certain pixel at a nearby summit and ask everyone to check that their registration yields this value before they begin digitization.
We are also making available a Landsat ETM+ scene taken on the same day as the ASTER scene, 21 Sept 2000. This scene was produced by EarthSat Corporation under the NASA Data Buy program. If an ASTER DEM is attempted, this ETM+ scene should be used to provide horizontal ground control points.
Please note that the Landsat data being provided through the Global Land Cover Facility are part of the GeoCover collection and are labeled orthorectified. This orthorectification was accomplished using proprietary software, but we have reason to believed it did not involve extensive terrain correction. See the GeoCover Story for more details.
Georegistration information for the ASTER scene:
Projection:  UTM, zone 10N, WGS-84
Pixel size:  15 m
Target point:  line (row) 2224, sample (column) 3062, -125.87606 Lon, 51.47407 Lat
See GLIMSView Screenshot
Georegistration information for the Landsat5 scene:
Projection:  UTM, zone 9N, WGS-84
Pixel size:  28.5 m
Target point:  line (row) 4531, sample (column) 5150, -125.87876 Lon, 51.47400 Lat
See GLIMSView Screenshot
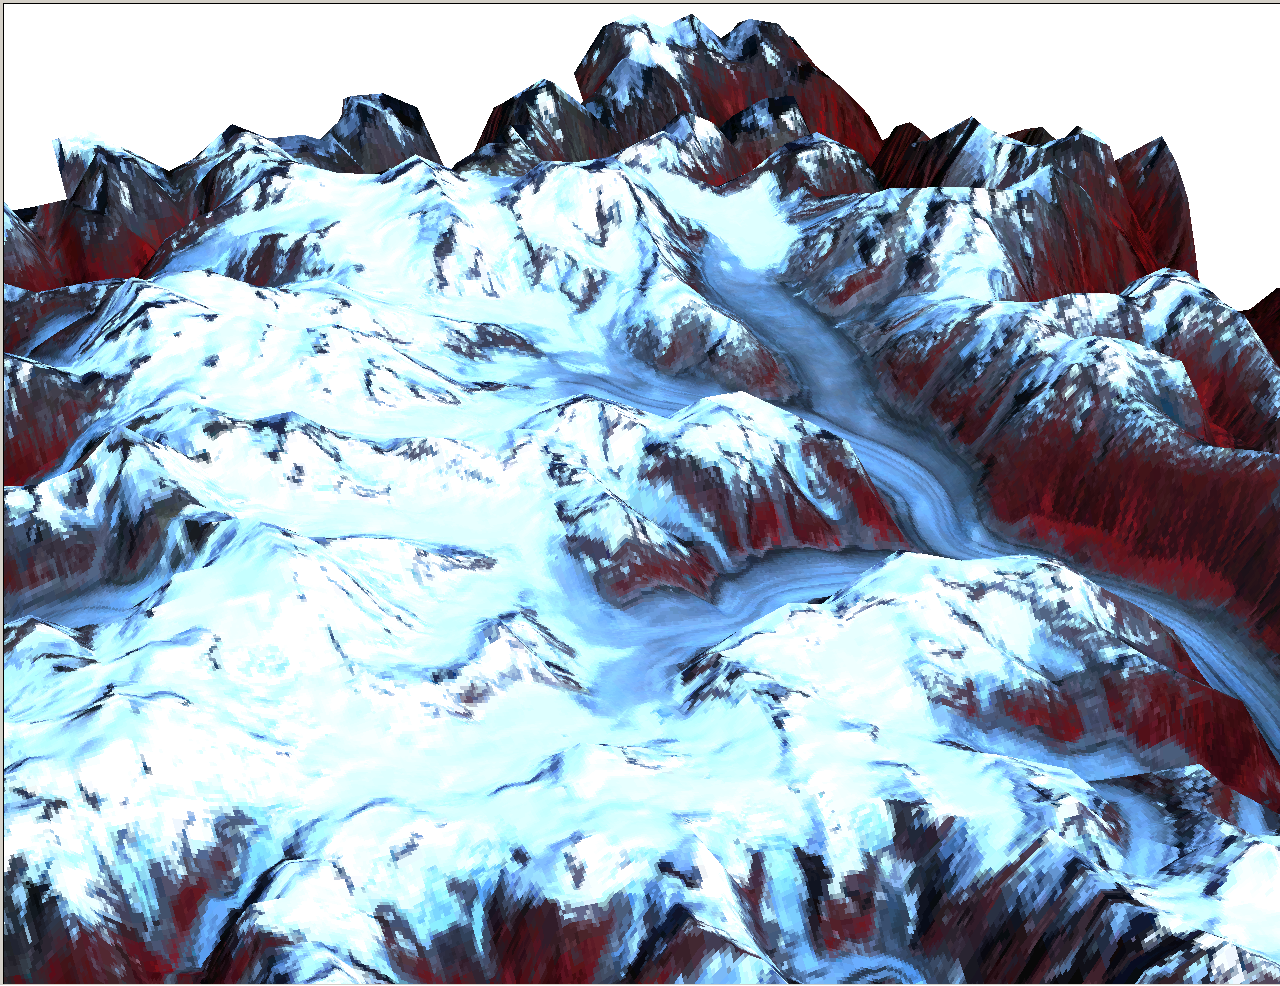
See the figure at the bottom of this document as well for another view.
Glacier outlines for both the 2000 ASTER scene and the 1991 Landsat scene, in latitude/longitude/WGS-84 coordinates, as (closed) polygons. For the ASTER scene, please use the geolocation data in the HDF metadata to determine the mapping between line/sample coordinates and lon/lat, even if you know it's incorrect. This is so that lon/lat coordinates from different groups will be comparable. The Landsat TM image is in GeoTIFF and thus should be correctly geolocated by most GIS packages. GLIMSView will properly geolocate either of these data types. See item below on Geolocation.
As much GLIMS-specific metadata as you can include. The primary goal of this test is to quantify variability in the glacier outlines, but variability in WGMS classifications are also of interest. Note that additional metadata about the processing procedures is requested at time of submission via the Web submission interface. Use of the GLIMS data submission interface will be mandatory, so we can capture this additional metadata.
Data should be in the (shapefile based) GLIMS Data Transfer Format. If this is not possible or too inconvenient, then we can accept ESRI shapefiles of the outlines and attributes, text files for the metadata, etc. We could also accept ESRI .E00 files, or GMT multi-segment files.
We would appreciate prompt attention to this experiment. Completion in time for discussion at the GLIMS Workshop in New Zealand in February 2006 is highly desirable. Any preliminary results that could be generated in time for the GLIMS Miniworkshop in Tucson, Oct. 24-25, would allow for some assessment as to how the experiment is going at that time. The results of this experiment are of paramount importance to the quality and usability of the GLIMS glacier database. At the latest, please have your results to us by 31 December 2005.
(we will post questions and their answers as they are submitted)
GLIMS Analysis Tutorial: http://www.glims.org/MapsAndDocs/assets/GLIMS_Analysis_Tutorial.pdf (PDF)
Data Transfer Specification: http://www.glims.org/MapsAndDocs/datatransfer/data_transfer_specification.html
GLACE II website (this page): http://glims.colorado.edu/glace/
The ASTER L1B image: http://glims.colorado.edu/glacierdata/data/glace/AST_L1B_003_09212000195118_09232003090414.hdf
The ASTER L1B image metadata file: http://glims.colorado.edu/glacierdata/data/glace/AST_L1B_003_09212000195118_09232003090414.hdf.met
The Landsat TM image: ftp://ftp.glcf.umiacs.umd.edu/glcf/Landsat/WRS2/p050/r024/p050r24_5t910921.TM-EarthSat-Orthorectified/
RGB (from bands 7,3,2) GeoTIFF of Landsat TM image (this is being provided because currently GLIMSView cannot create an RGB image from data in separate files, and the Landsat data at the GLCF has one file per wavelength band of the instrument). See image below: http://glims.colorado.edu/glacierdata/data/glace/p050r24_5t910921_RGB_subset.tif
Worldfile for the above GeoTIFF: http://glims.colorado.edu/glacierdata/data/glace/p050r24_5t910921_RGB_subset.tfw
The Landsat ETM+ image (for reference): ftp://ftp.glcf.umiacs.umd.edu/glcf/Landsat/WRS2/p050/r024/p050r024_7x20000921.ETM-EarthSat-Orthorectified/
Canadian Digital Elevation Dataset DEM, UTM projection (as depicted above): http://glims.colorado.edu/glacierdata/data/glace/canadian_DED_UTM_15m.tif
Canadian Digital Elevation Dataset DEM, lon/lat (equidistant cylindrical) projection: http://glims.colorado.edu/glacierdata/data/glace/glace_demlaltlon.img
SRTM DEM: ftp://ftp.glcf.umiacs.umd.edu/glcf/SRTM/WRS2_Tiles/p050/SRTM_u03_p050r024/
GLIMSView: http://www.glims.org/glimsview/
ASTER Geolocation help document: "Geo-Referencing ASTER Level-1B Data" (2.1 MB PDF file)
GLIMS website: http://www.glims.org/
GLIMS Data Submission Interface: http://glims.colorado.edu/submissions/
First Round-Robin experiment pages: http://glims.colorado.edu/glace/RR/
This document in PDF form: http://glims.colorado.edu/glace/Summary_final.pdf
This document in OpenDocument form: http://glims.colorado.edu/glace/Summary_final.odt
Points of contact: Bruce Raup (braup@nsidc.org), or Siri Jodha Singh Khalsa (sjsk@nsidc.org)
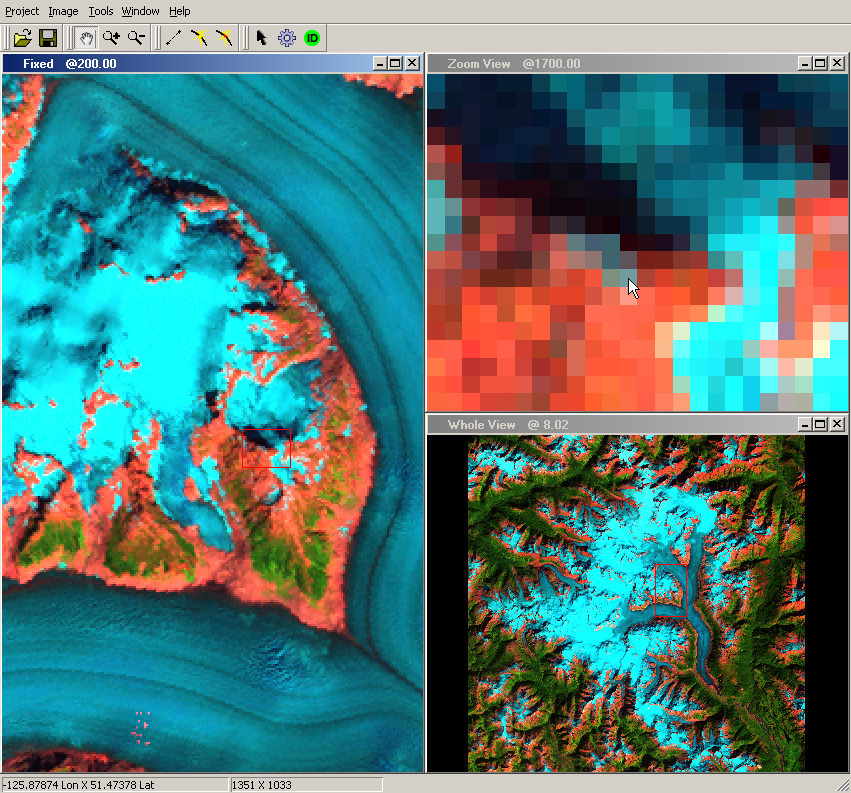
Locator
image. The image is the RGB GeoTIFF image linked to above. The
lon/lat position of the mouse cursor is displayed in the lower-left.